Hi, I'm Xiaojing Guo (Jing)
Statistics/HCI Graduate
📧xjing225@gmail.com 📞0415860885 LinkedIn
Welcome 😊 This portfolio site showcases four of my latest projects: Browsing Insights, a Chrome extension for advanced web history filtering, comparison, and visualization; Netflix Originals Analysis, which uses web scraping and data visualization with Python to uncover Netflix production trends and IMDb audience reception; Hotel Booking Analysis, which uses PowerBI to build a dashboard for hotel operation and uncover trends in booking demands and other key metrics; and Twist-Con, a project dedicated to designing a VR controller that specifically enhances haptic feedback for twisting motions across various scenarios.
Browsing Insights
Keywords: Chrome Extension, Chrome API, HTML, CSS, JavaScript
Overview
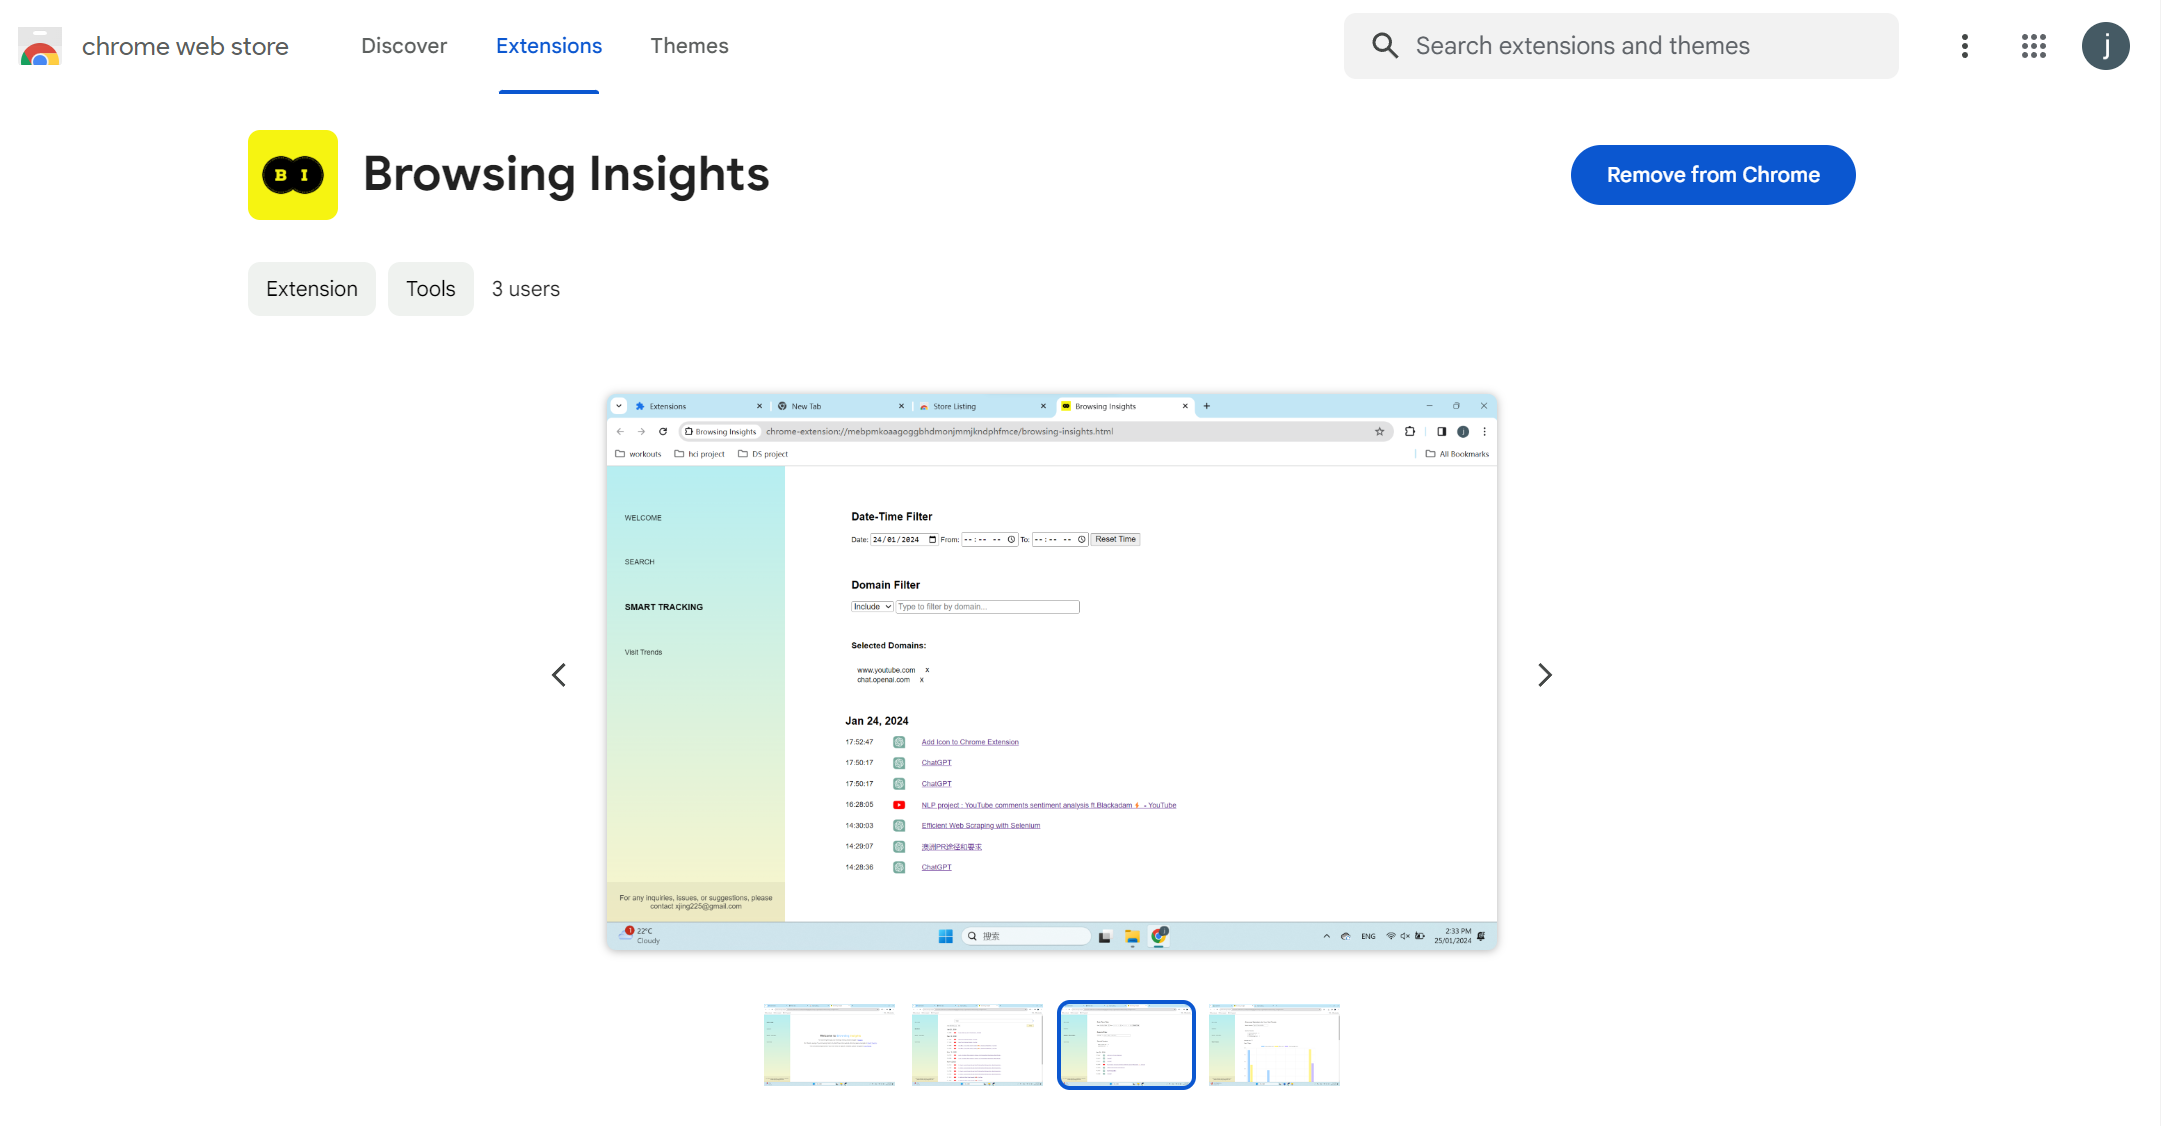
"Browsing Insights" offers practical features for users looking to track and analyze their browsing histories. It includes an advanced search function, a smart tracking system with customizable filters for date, time, and domain, and a 'Visit Trends' feature that provides graphical insights into website visit counts over different time periods. Ideal for users who want a clear overview and a better reflection of their online activity. Available for installation from the Chrome Web Store.
About this Study
Default browser history tools fall short in terms of functionality and flexibility for users seeking deeper insights into their browsing activities, standard browser history tabs like those in Google Chrome or Microsoft Edge only provide a chronological list of visited sites, lacking functionalities for flexible navigation and reflective practices. Seeing this gap, this study aimed to develop an extension to the Google Chrome browser which not only logs users' histories but offers features that assist with flexible, site-based tracking and gaining a deeper understanding of online activities through data visualization. It has capabilities for searching, sorting, customizable record-tracking by date, time, or site domain, and graphical displays of site visits across different time frames.
On the technical side, the tool was developed with Chrome history API for data retrieval, and considerations were given to the overall layout and functionalities of the extension. User-friendly features, such as infinite scrolling, debounced search, and suggestion lists for typed information were integrated. Guidance was provided on the homepage, and error prevention mechanisms were embedded for various user inputs. Further, users had viewing options for the data visualization of stacked or non-stacked comparative bar charts. For flexibility, users could also decide which site or sites they wanted to include or exclude from their tracking.
Source Code
https://github.com/xjing0225/HCI-ProjectNetflix Originals Data Analysis
Keywords: web-scraping, data visualization, selenium, matplotlib, word clouds

Objective
The objective of this study is to conduct a comprehensive examination of Netflix Original productions, leveraging data scraped from IMDb and focusing on their proliferation, audience reception, and thematic diversity from 2012 to 2023. The primary focus of this research is on data scrapping and visualization, aiming to illustrate patterns in production volume, genre popularity, and perceived quality through IMDB ratings. It seeks to provide insightful visual representations and to understand trends and preferences in Netflix Original content, highlighting the types of content that resonate with audiences and how Netflix's content creation strategies align with viewer preferences.
Findings
The number of Netflix original productions exhibited a steady increase from 2012 to 2020, peaking in 2022 before experiencing a slight drop in 2023. From 2017 to 2020, each genre saw growth in production, with drama and comedy showing the most significant increases. Genres such as war, talk shows, westerns, and musicals remained relatively stable from 2017 to 2023. Following the peak in 2022, all genres experienced a drop in 2023, except for history and thriller, which saw a noticeable increase
The most prevalent content ratings among the shows were MA15+/M (for mature audiences). Despite the variation in ratings, there was no significant differentiation in IMDb scores. Genre-wise, IMDb scores varied, with history and war receiving the highest scores, while horror and romance received the lowest.
The most produced genres, including Drama, Comedy, Documentary, and Crime, align with those seen in the top 10 voted programs on IMDb each year from 2012 to 2023. However, IMDb scores for these top-voted programs have declined in recent years, compared to before 2016. Word clouds associated with these popular programs revealed themes such as "world", "new", "relationship", "father", and "friends".
Each year, the top 10 programs with the highest IMDb ratings predominantly fell into genres such as Drama, Comedy, Crime, and Animation. Their descriptions commonly included keywords like 'family,' 'child,' 'protagonist,' and 'friend.
Source Code
Netflix Originals Data Analysis.ipynbHotel Booking Analysis (PowerBI)
Keywords: Hotel Booking, Data Analysis,Data Visualization, PowerBI
Findings
An overall analysis of hotel bookings from 2015 to 2017 reveals that demand was highest in 2016, with the City Hotel consistently more in demand than the Resort Hotel. August saw the peak in room requirements across all types, boasting the highest average nightly rates. January featured the highest occupancy rates, while April and June experienced the highest cancellation rates annually. About 90% of guests opted for rooms without a deposit requirement, and over 80% booked through travel agencies (TA/TO).
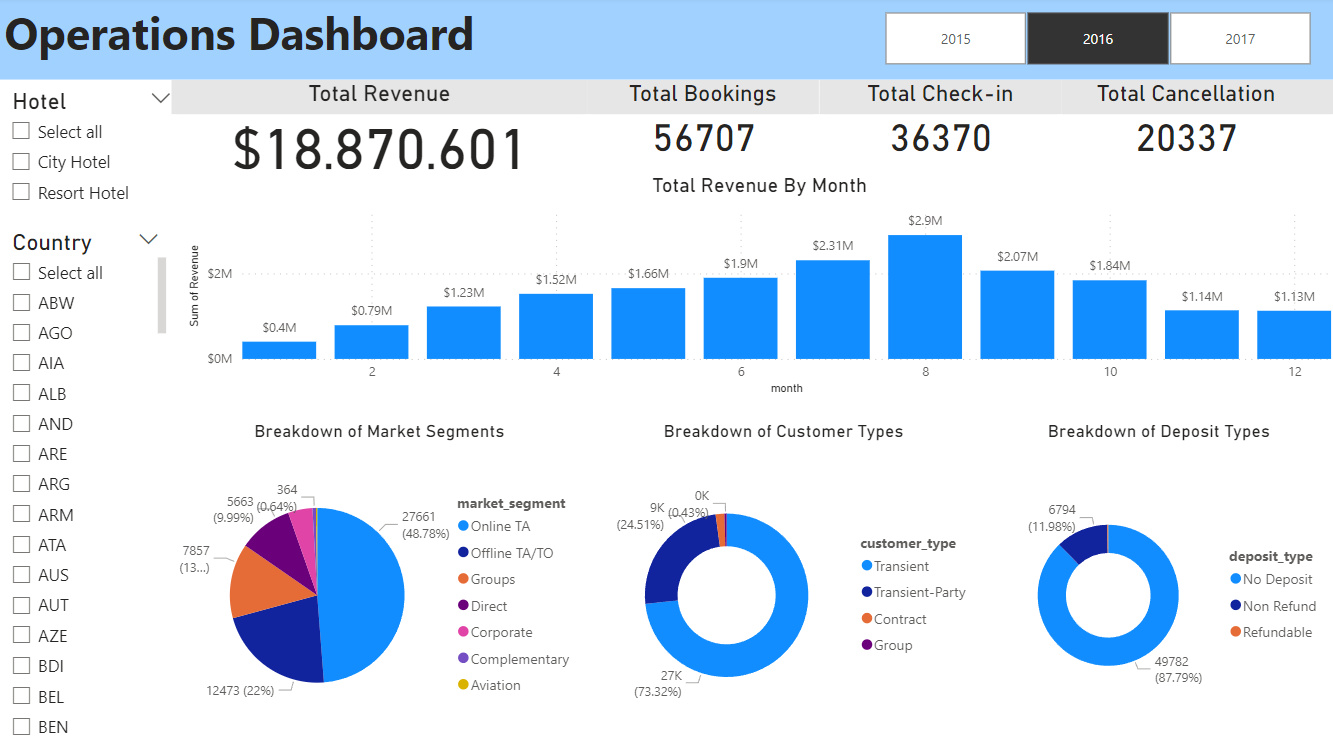
Analyzing successful bookings and stays, room types A and D were most popular. Occupancy rates peaked at the end of each month. Canceled bookings had an average confirmation time of 3.6 days, and bookings made three months in advance had the highest cancellation rates.
For Resort Hotel, demand in July was higher than City Hotel for both weekdays and weekends, with the highest nightly rates observed in July and August, signaling peak season with maximum room demand. Conversely, January had the least demand with the lowest rates, denoting the off-season, with weekday demand surpassing weekend. In February, repeat visitors were most likely to cancel bookings, which often underwent changes before cancellation, while September saw the most instances of repeated cancellations.
Source Code
Hotel Bookings Data Analysis.pbixTwist-Con
Keywords: Unity 3D, VR Games, Arduino
Overview
The objective of this project was to design a controller that enhances haptics for VR experiences. Traditional VR controllers, while designed to accommodate the most common use cases and interactions, fall short in delivering realistic haptic feedback for specific scenarios. That's where Twist-Con comes into place: a VR controller specifically designed to simulate the haptic sensations associated with various twisting motions and scenarios.

About this Study
At the heart of the controller is a hobby motor with a built-in encoder, which utilizes PID control logic to achieve the haptic feedback of resistence torque. This system is programmed using Arduino and a UNO board. To house the hobby motor, the controller's body is constructed from laser-cut plywood pieces that tessellate to secure the motor. This assembly is enhanced by a living hinge pattern on the arm holder for added flexibility and comfort. Additionally, three types of 3D-printed knobs can be mounted atop the motoe's shaft, enabling users to engage with twisting actions on objects of various shapes.


The VR game, developed in Unity, features three distinct scenarios designed to immerse users in the tactile experiences of: manipulating a motorcycle handle, turning a peppermill cap, and winding up a toy robot.

Introduction Video
https://youtu.be/AAnf_hnPTeoTHANK YOU 😊
📧xjing225@gmail.com 📞0415860885 LinkedIn
Back to Top ↑